Overview
Objective
KYN is a non-diversified, closed-end fund with an investment objective to obtain a high after-tax total return for its shareholders by investing at least 85% of our total assets in energy-related master limited partnerships and their affiliates (“MLPs”) and in other companies that operate assets used in the gathering, transporting, processing, storing, refining, distributing, mining or marketing of natural gas, natural gas liquids, crude oil, refined petroleum products or coal (collectively with MLPs, “Midstream Energy Companies”).
| Symbol | KYN |
|---|---|
| Exchange | NYSE |
| CUSIP | 486606106 |
| Inception Date | 9/28/2004 |
| Total Assets† | $1,434 million |
| Leverage† | $873 million |
| Distribution ($/share)1 | $0.12 |
| % of Portfolio Assets with Call Options† | None |
Investment Merits
Midstream Opportunities
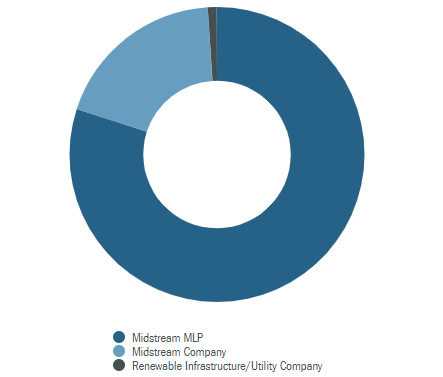
- Opportunity to invest across the full value chain for the midstream sector through investments in midstream MLPs and midstream companies
- Midstream sector is expected to generate attractive risk-adjusted returns for investors; companies are expected to generate stable cash flows from fee based assets with high barriers to entry
Attractive Fund Structure
- KYN issues a Form 1099 (as opposed to K-1s issued by MLPs)
- Suitable for IRAs, foundations and tax-exempt accounts, because unlike direct holdings in MLPs, KYN does not generate unrelated business taxable income (UBTI)
Access to Private Investments
- KYN provides access to private investment opportunities not otherwise available to retail investors
Daily Pricing
as of 4/3/20
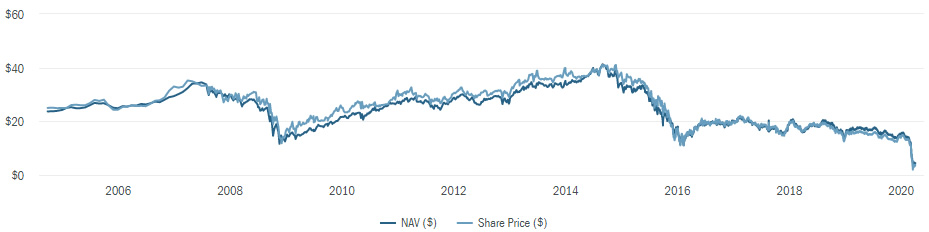
| Share Price | $3.67 |
|---|---|
| NAV | $4.42 |
† As of 3/31/20
1 Payable on 4/30/20 (ex-date 4/22/20). (See “Distributions” section below for more information).